- Abstract
Enterprises “Love” their data when relationships between the data are simple and “Hate” when relationships become complex. Gone are the days when enterprises kept adding new tables to add new data entities and adding new columns or tables to define new relationships between data. It is time to rethink database selection when enterprises are investing in their modernization journey.
- Key takeaways
When relationships between data become the main concern and not just the data itself, then even small and medium enterprises should shift their mindset to start using graph databases like Fortune Enterprises, LinkedIn, Instagram, Twitter, Amazon, Facebook, Google, etc.
- Introduction
“Data is a precious thing and will last longer than the systems themselves” – Tim Berners-Lee. We keep on modernizing the applications, re-platforming, re-architecting, and even rewriting entire business logic into new programming languages to stay competitive with technology trends. But the longevity of data is far longer than that of the system or products. More or less every Company is a Data Company – but not every company is good at Data management, especially when data grows and relationships between data become complex. It is time to rethink database selection when enterprises are investing in their modernization journey. Is it prudent to replatform the data rather than just rehost it? In this forum, we will discuss how one of the cutting edge popular databases, like the Graph database, can be a choice for selection and demonstrate a step by step guide to help the readers understand the migration journey.
- Traditional Relationship
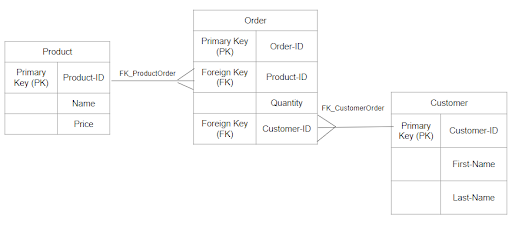
It is practical to use traditional relational databases as long as we are managing a modest number of relationships. This is the very first choice for small and startup enterprises, as relational databases are popular and have already proven themselves in the database market. Over time, when business grows and there are hundreds of relationships among tables, the conventional relational table’s foreign key setup becomes a nightmare for database designers. Most of the time, the relationship is handled using complex application program logics – without daring to switch to a different database that uses modern query languages. In a traditional relational database, the data is organized into tables, rows, and columns. The number of columns is fixed, depending on the required structure. This model works best when dealing mainly with data from one table or a couple of tables. A simple and popular illustration of the traditional usage of relational databases is the customer-order-product relationship.
- Application Program Hurdle
In many organizations, the entire relationship among all different data sources or tables is maintained using application programs. The database tables live in isolation, and programs take care of building the relationship at runtime. This is a very traditional way of doing the work. When modern databases offer faster query languages, why not take advantage of those databases and their services to do the same or similar functionality at the database level itself? A sample use case for building such a relationship using isolated tables is shown below. Multiple sources of data share a common entity – say the person key attribute. When it needs to build up the linking among all these data sources, it reads individual data sources and filters down the data to build up a person centric relationship among them. – is done by application code.
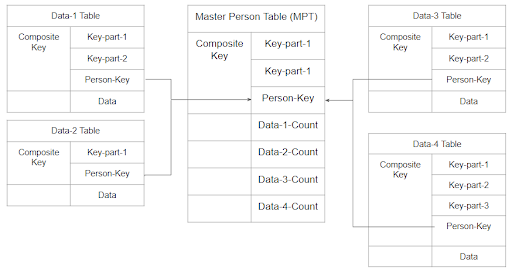
To explain it more, a Master Person Table (MPT) is designed. Along with its own key splits, a common key portion (let’s call it Person-Key) is also part of a composite key. This Person-Key plays the main role in all relationships among all tables. The MPT may also keep track of the number of record counts for individual tables belonging to the same Person-Key. While writing new records in individual tables, the MPT also always needs to be in sync. While reading, the MPT needs to be read first to know how many records belong to a Person-Key. That count can be used to filter down records from individual tables, putting a burden on the application program to handle the relationship. In this paper, we will discuss how we can resolve these complexities using Graph database features.
- Basics of Graph Database
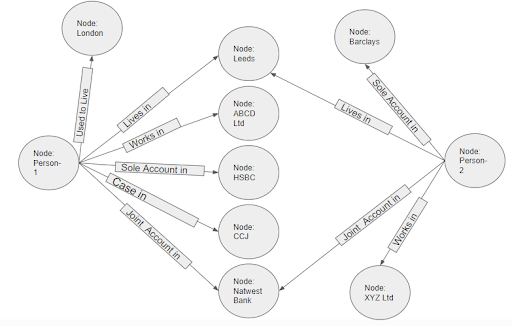
In mathematics, a graph is described as a collection of nodes (or vertices), and each node contains properties along with labels defining relationships (or edges) between nodes. Here is a simplified Graph Database relationship for a Credit Industry to tell person-1 works at ABCD Ltd.; he currently lives in Leeds; he used to live in London a few years ago; he has a HSBC credit card; he has one Country Court Judgement (CCJ) case against him; and he has a joint savings account with his spouse. The spouse (person-2) has various data points. If we draw this database into a picture of nodes, node properties, and relationships between all nodes, we will end up with the below graphical structure, and that’s why it is called the Graph Database.
- Popular Types Graph Database
Neo4j: Neo4j stands for Network Exploration and Optimization in Java. It is written in Java with native storage and processing.
JanusGraph: JanusGraph is popular among big data analysts. It is an open-source and scalable graph database.
DGraph: DGraph, also known as a distributed graph, was designed with scalability in mind.
DataStax Enterprise Graph: The DataStax Enterprise Graph is based on Cassandra.
- Migration Journey to Graph
Companies that are adopting new database technologies, such as Neo4j, will already have data stored in some type of database. It is more likely that the database type will be a relational database. The question is how data in row/column with primary/foreign keys can be migrated to nodes and relationships between nodes. This section shows different ways of migrating data and shows an example journey of how relational data can be migrated to the graph database – Neo4j is considered a use case).
- The different ways of migrating data are listed below.
- Load CSV – Importing a dump of individual entity-tables and join-tables formatted as CSV files
- APOC (Awesome Procedures on Cypher) – This is a library bundled with Neo4j, and it is especially helpful for complex transformations and data manipulations.
- ETL Tool – Neo4j Labs UI tool that translates relational data to graphs using a JDBC connection. It is useful to import bulk data with fast performance and a user-friendly UI.
- Kettle – open-source tool that can import a variety of data sources and organize the data flow process.
- Programmatic via driver – ability to retrieve data from a relational database (or other tabular structure) and use the bolt protocol to write it to Neo4j through one of the drivers with your programming language of choice.
- An Example Migration use case
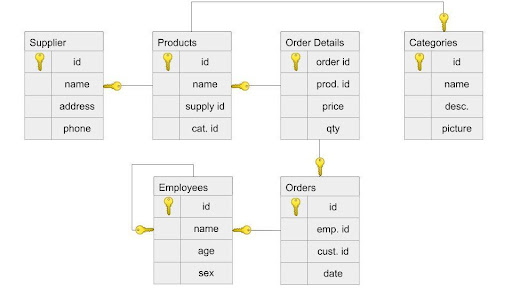
Let’s consider traditional relational tables and the relationships among them to illustrate the migration process. The schema below shows the data structure of a relational database for recording data on products from suppliers sold to customers.
Neo4j ETL tools are one of the methods that can be used to migrate data. The section shows how that tool is used.
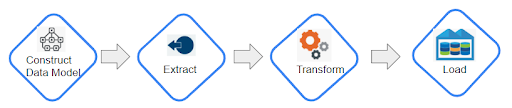
Step-1 Construct a data Model:
In relational databases, we design schema. Similarly, in graph databases, we need to design graph models. When migrating data from relational to graph, the following rules need to be followed.
- A row in table is node in graph
- A table name is node label
- A join or foreign key is a relationship between two nodes
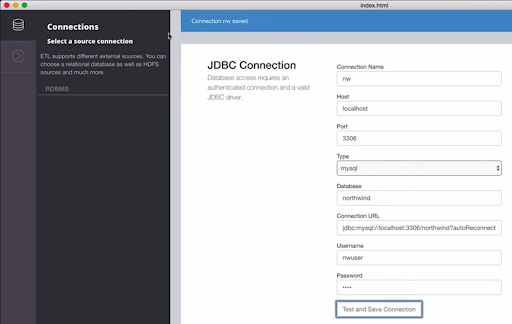
With the Neo4j ETL tool, such a model can be created interactively. The following screenshot shows the full process of Extract, transform, and Load.
First, connect the tool to the source database using JDBC and test the connection.
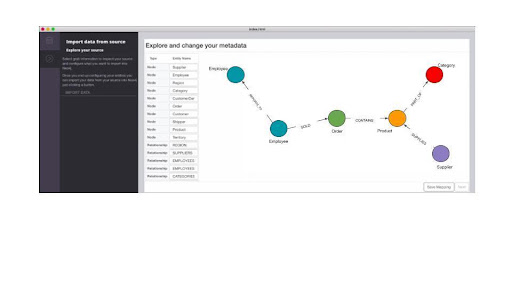
Step-2 Extract:
Once a connection is made between the tool and the source database, the tool extracts the metadata. Then it creates the data modal by converting row/column and primary/foreign to nodes and relationships between nodes using the rules defined in the above section. The screenshot below shows such a model and its metadata.
Step-3 Transform:
This stage is used to modify node properties and relationships if necessary. The screenshot below shows how that can be done interactively.
![]()
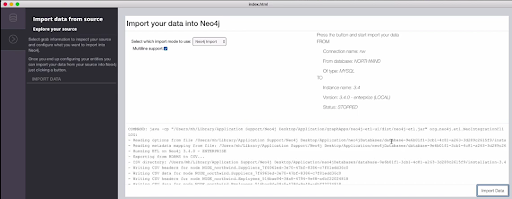
Step-4 Load:
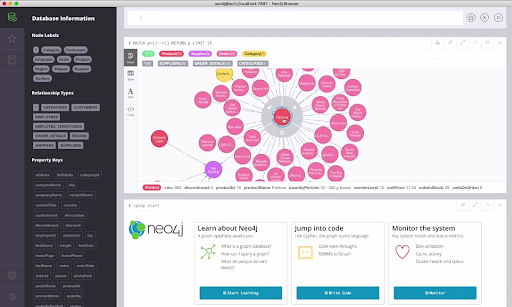
Once the data and metadata have been verified, the final stage is loading the data into Neo4j. The tool imports data and progress can be monitored. The data then can be visualized interactively as shown in screenshots below.
- Advantages of Graph Database
- Agility – Graph databases are the ideal solution for an adaptive environment, where unified progress and management is becoming the standard.
- High performance – allow users to query linked data quickly and efficiently making them much faster than traditional relational databases.
- Data Integrity – Irrespective of data source and formats, graph database maintains the integrity of data connections.
- Scalability – The schema and structure of the graph model is incredibly adaptable – just add to the current structure without disrupting its existing functionality.
- Enhanced contextual awareness – In graph database data is stored in the form of node property and relationship between nodes. This helps users to visualize and discover interactions between data which may not be obvious in traditional databases such as tabular relational models or hierarchical tree structures.
- Some Challenges to be considered:
The general challenges of graph databases to be considered for required use case:
- There is no standardized query language. The language depends on the platform used.
- Graphs are inappropriate for highly transactional-based systems.
- Sometimes finding support could be hard as the user-base is small.
- Market Trends
The recent trends seem to suggest even small & medium enterprises start to adopt Graph databases. Below are the ranking scores published in db-engine.com this year.
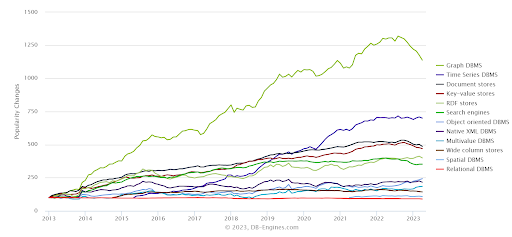
Graph databases are growing and it is becoming the go-to DBMS for small, medium and large organizations. The popularity has shown consistency since 2013. The graph database market in 2020 is reported to be $1.59 billion dollars and it is expected to increase to $11.25 Billion by 2030.
- Conclusion:
Sometimes breaking the tradition and daring to try out new things helps enterprises to grow more. Even though the Graph database is mostly adopted in big fortune enterprises, the features of this database can help small & medium enterprises in their modernization journey. When companies are ready to invest so much money in migration projects, why not consider modern databases like Graph and get more future proof by investing a little bit more.
Abbreviation:
SQL : Structured Query Language
ETL : Extract Transform Load
MPT : Main Person Table
APOC : Awesome Procedures on Cypher
PK : Primary Key
FK : Foreign Key